

Aerodynamic Mapping
Aerodynamic mapping is an essential tool for understanding and optimizing the aerodynamic performance of vehicles, particularly in motorsports and automotive engineering.
In this article you will discover:
-
Why aeromapping is key
-
How VFluid conducts aeromaps
-
How aeromapping can enhance your vehicle performance
What is aerodynamic mapping?
Aerodynamic mapping is a systematic process used to understand and quantify the aerodynamic characteristics of a vehicle or an aircraft. It involves measuring and analyzing forces such as lift, drag, and side force, as well as moments affecting stability and control, also known as aerodynamic balance. With an aero map engineers can predict performance in various conditions and optimize designs for efficiency and stability.
Why is aerodynamic mapping Important?
Aerodynamic mapping plays a critical role in motorsports and automotive engineering. Here’s why it’s essential:
-
Performance Optimization: In motorsports it is critical to understand the behavior of a car along a track and any sensitivities to pitch, heave, roll or yaw, providing engineers with the fundamental information to choose the static setup of the car.
-
Safety and Stability: In automotive design, understanding aerodynamic forces ensures stability, control, and compliance with safety regulations.
-
Energy Efficiency: Reducing drag can significantly lower fuel consumption and emissions in automotive applications. In motorsports the selection of the initial drag to downforce ratio is a key part of the initial setup of the car for every race.
-
Design Validation: Engineers rely on aerodynamic mapping to verify computational simulations and ensure real-world performance aligns with theoretical predictions.
What tools can be used to generate an aero map?
Aerodynamic mapping can be done in several ways, with a combination of experimental testing and simulations:
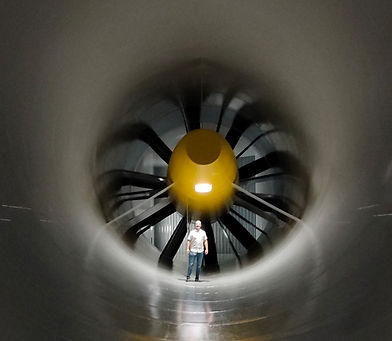
1. Wind Tunnel Testing
A physical scale model or full-scale prototype is placed in a controlled wind tunnel environment to measure aerodynamic forces and pressure distributions. The models are equipped with hydraulic actuators which allow the variation of the ride height (RH), roll angle and yaw angles of the vehicle to measure the performance in several attitudes simulating different working conditions. In cars aerodynamic mapping involves sweeps of straight line conditions, braking, acceleration and low, medium and high speed corners.

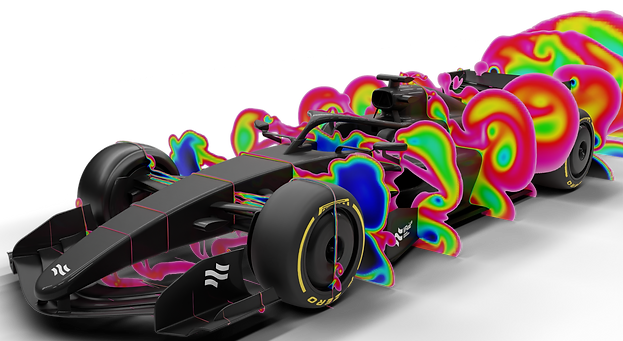
2. Computational Fluid Dynamics (CFD)
CFD simulations allow engineers to analyze airflow patterns and forces digitally, providing high-resolution data without the need for physical prototypes. CFD complements wind tunnel testing by offering detailed insights into complex flow phenomena. A similar approach to the wind tunnel can be taken using CFD. A number of simulations are performed while varying the attitude of the car in order to understand the sensitivities of the vehicle (variations of pitch, heave, roll and yaw) as well as overall stability and performance across different types or corners or in straight line.
There are several advantages to performing aerodynamic mapping in CFD compared to the wind tunnel: the obvious one being that there is no need to design and build a physical model but most importantly, it provides a significant amount of data for a low cost which allows engineers to address any shortcomings in the design by analyzing flow fields and flow structures in different conditions accelerating design and development time frames.
3. On-Track Testing
For applications like motorsports and aviation, real-world testing is conducted using pressure sensors, flow probes, and telemetry systems to validate aerodynamic models in actual operating conditions. This type of aerodynamic testing is mostly used for validation and great care needs to be taken when analyzing the data. Unlike controlled wind tunnel tests, the operating conditions are subject to external variables such as ambient temperature, track temperature, wind speed and direction, which can impact results. Therefore, careful preparation is required to ensure proper sensor placement and data correction strategies, allowing for accurate interpretation of the aerodynamic performance.

4. Data Analysis and Correlation
Once data is collected from wind tunnel tests, CFD simulations, and real-world experiments, engineers analyze and correlate the results. This step ensures accuracy and consistency, enabling data-driven design improvements. Obtaining data from different sources is the only way to ensure the continuous improvement of the tools. All tools have strengths and weaknesses, wind tunnel tests can be the best representation of reality, however it is important that all boundary conditions are considered and represented correctly which can be challenging for example when dealing with tyres. Furthermore, the preparation of a wind tunnel test can be time consuming and expensive, especially if the level of accuracy required is high, but also the amount of data obtained from the test can be limited to force values unless further investment is made to include several pressure taps and other visualization tools such as PIV. On the other hand, CFD simulations provide a significant amount of data for a much lower cost, however CFD simulations rely on simplifications of the physics being modeled and validation is advisable if not required. Finally, real-world testing can also be expensive as it requires a working prototype, therefore it is reserved for an advanced period of the project. It also involves the inclusion of several sensors to be able to correct for uncontrolled variables (wind, temperature) and in some cases unavoidable deltas which cannot be corrected.


How is an aero map selected?
Aero maps are based on the real-world behavior of the vehicle and therefore it needs to be representative of the performance of the vehicle. The selection of the attitudes to be tested will provide a characterization of the vehicle and, together with a selection of weighting values for each attitude, a final value weighted value for the downforce and drag coefficients will be obtained. By using the weighted values, the performance of the vehicle is better represented in contrast to relying on the values from a single attitude to judge vehicle performance.
In order to choose the values, the ideal scenario is to have real-world data from said vehicle. Telemetry data can provide the necessary information to select the different attitudes for the aero map. Statistical analysis based on the real-world data is required to narrow down the working conditions of the vehicle. In the case of a race car for example, a set of attitudes can be selected to quantify the drag weighted coefficients based on power limited points (i.e. straight-line conditions), while the downforce weighted coefficients can be based on grip limited points (i.e. cornering). The different attitudes and weighting values are selected by filtering of roll, yaw angles and data analytics methods to select the most used RHs across a lap, in different tracks if available. In the case real-world data is not available, an initial educated guess will be necessary, and experience can make a significant difference. In all cases, it is important to consider that a number of discreate sensitivity checks need to be included, this means running yaw, roll and front RH and rear RH sweeps to analyze sensitivities.
How does VFluid perform aero maps?
VFluid is capable of performing aero map measurements using all three tools: wind tunnel testing, CFD simulations and on-track testing.
1. Wind Tunnel Testing
For a wind tunnel test it is necessary to design and build a prototype, although a released car can also be used for full scale tests. The approach for a model scale test and a full scale test are very different. In the case of a scale model, the prototype needs to have an internal chassis that can accommodate to the wind tunnel facility’s balance, be it internal or external, so that the vehicle RH, roll and yaw angles are modified. The model does not rest on top of the wind tunnel road, it is held by a strut which controls the position with respect to the ground by the use of at least three laser distance sensors which allow the control of pitch and roll angles. It still needs to have a suspension system so that the wheels stay on the ground. The complexity of this system can vary depending on the requirements of each project, for a road car having simple suspension kinematics which allows the wheels to move without major camber variations might be enough given that contact patch shape is not critical. However, when dealing with ground effect race cars, the contact patch shape can have a significant effect on aerodynamic forces. Because of this, the suspension system must represent the real kinematics of the car so that the motion of the wheel is as what will be seen on track. If higher accuracy is required, different actuators can be included to steer the wheels and push the wheels down into the road of the wind tunnel in order to obtain a representative contact patch shape for each attitude.
When running a full scale model, the setup will depend on the type of car that is being tested and the type of wind tunnel. When testing racing cars, a wind tunnel with a single or a three belt system must be used so that the flow under the vehicle is well represented in comparison to the real-world application. The prototype will have a representative suspension system, but it must accommodate to a hydraulic system which will control the RH and roll angles of the vehicle. The car is fixed to the wind tunnel using a set of arms on the front wheels and in some cases also at the rear depending on the wind tunnel. The yaw angle is controlled by a rotating platform where the car stands. In both cases the setup of the car prior to the test is key to making sure that the ride height system is working properly and accurately. If we are dealing with a road car, the ground effect is minimal and therefore it is possible to run on a five-belt road system. By using this type of road, the car can be fixed using a clamping system that is controlled by actuators which allows for the pitch and roll to be modified without the need for installing a hydraulic RH system of the car (the use of actuators for the clamping system will vary from one tunnel to the next). Unfortunately, this type of road does not provide a representative flow between the car and the road as it does not have a rotating belt between the front and rear wheels so it cannot be used for motorsport purposes.
Once the vehicle is installed in the wind tunnel, the model is tested on each one of the attitudes depicted in the aero map and the forces are averaged for a specific period of time. Based on the averaged values, the forces are then multiplied by the drag and downforce weightings and a final weighted value is obtained for drag and downforce.
2. CFD Simulation
When dealing with CFD simulations, the requirements narrow down to a closed surface CAD model, wheel kinematics data and the different boundary conditions such as wind speed, radiator and fan coefficients.

With this information it is possible to generate a template of the CFD model which uses the kinematics of the vehicle to accurately simulate the motion of the wheels for every attitude. The shape of the wheels can also be modified depending on the availability of a tyre model from the manufacturer, this would allow for a more accurate representation of the contact patch.
With the CFD model finished it is a matter of introducing the different attitudes that need to be tested and submitted to the cluster. VFluid has developed a system that allows for any attitude to be tested automatically without further manual work saving time and costs while ensuring repeatability of the process. A few hours later the results can be analyzed.
An example of this is provided based on an F1 2026 spec car (prior to the latest regulation update). The drag and downforce coefficients are obtained based on an aero map shown below. This aero map is an educated guess and a simplification of what a real aero map would be based on track data.

The results show that the weighted average performance of this F1 car spec is roughly CdA 1.11 and CzA of -2.47.

As mentioned before, the aero map can be used to understand how the car would behave around a track and if there are any sensitivities that need to be corrected. Some of the information this areo map shows:
-
A reduction in SCz at low RHs is accompanied by a reduction in SCx, this is a positive feature for straight line performance.
-
Overall, the SCz range across the map is roughly 0.35 SCz which accounts for roughly 14% of the total SCz, the range variation can be improved.
-
The SCz performance improves at higher rake angles.
-
The aero balance varies mostly with pitch while it remains consistent with heave.
-
The yaw sensitivity graph shows a low sensitivity from the front end of the car with a higher sensitivity at the back of the car as the yaw increases. Nearly double the amount of rear downforce is lost compared to front downforce when the car is yawed by 4deg. This also highlights another area of potential improvement.


The analysis of an aero map will serve as a guideline for further development as well as the basis for on-track setup.
Conclusions
Aerodynamic mapping is an essential tool for understanding and optimizing the aerodynamic performance of vehicles, particularly in motorsports and automotive engineering. By systematically analyzing aerodynamic forces and their sensitivities to vehicle attitude changes, engineers can make informed decisions that enhance performance, stability, and efficiency.
The combination of wind tunnel testing, CFD simulations, and on-track validation provides a comprehensive approach to aerodynamic mapping. While CFD offers a cost-effective and data-rich method for preliminary studies, wind tunnel tests remain invaluable for high-accuracy validation. On-track testing, though influenced by external variables, is crucial for real-world performance assessments.
The results of an aerodynamic map not only guide vehicle setup but also highlight areas for further optimization. Sensitivity analysis to factors such as pitch, heave, roll, and yaw allows engineers to refine aerodynamic characteristics, leading to improved stability and efficiency. In motorsports, this information is critical for achieving optimal drag-to-downforce ratios across different track conditions.
By leveraging a structured aerodynamic mapping process, engineers can bridge the gap between theoretical models and real-world behavior, ensuring that vehicle performance aligns with design expectations. Future advancements in CFD automation, wind tunnel methodologies, and sensor technology will continue to refine this process, making aerodynamic mapping even more precise and efficient.
Trusted by the Best
Did you know that the FIA entrusts us with wind tunnel homologation for World Endurance Championship (WEC) cars? To carry out the homologation, we perform an aeromap of every car in the wind tunnel and provide consulting to the FIA to select the maps to use based on real track data from the teams.
We bring the same level of expertise and attention to detail to every project we undertake, whether for motorsport or other high-performance applications.
Partner with the team trusted by the FIA to deliver motorsport-grade performance and cost-efficient solutions to your project.
